Aerodynamics plays a very big part in a race car’s performance, and we need some means of evaluating potential solutions so we can compare various approaches, and then choose the most effective one. Fabricating and testing all of it is not practical. Fortunately, we have SolidWorks Flow Simulation CFD package. CFD stands for Computational Fluid Dynamics and it’s a sophisticated program that simulates fluid flow around a solid object and allows visualization as well as measurements. In many ways it can be more useful than real world testing because it gives insights not possible in real life. There’s a huge caveat though – it’s only useful if it’s accurate. And that’s much harder to do than one might think.
The way CFD works is that it breaks up the solid and the surrounding fluid (air, in our case) into cells. This process is called meshing. The flow is then propagated from one cell to the next and their interactions are taken into account. Once a pass is completed, its results are saved and another one is started using the saved results. It’s a repetitive process. In the first few passes the results vary greatly, but they eventually settle out or ‘converge’. In a large model this can take several hundred passes. Once acceptable convergence is achieved, the computation can be considered complete. The result is flow direction, velocity and pressure in each single cell. A car model typically has several million of them.
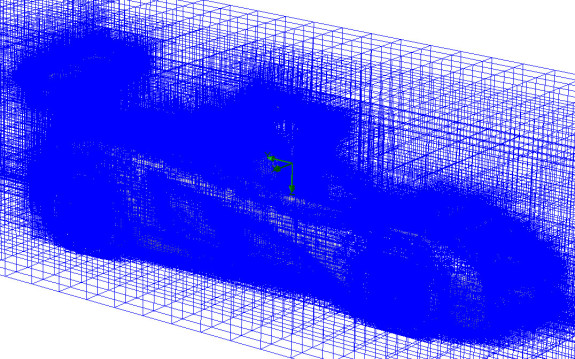
The smaller the cell size the better accuracy, but the more memory and computational time it requires. In order to optimize the process, smaller cell size is used in areas with a lot of detail or small features, and larger cells can be used in open areas or where features are larger. In some CFD programs the person setting up the simulation is required to configure the mesh. This is a very time consuming process and is as much of an art as it is science. The SolidWorks program uses an intelligent algorithm to figure out an initial mesh (one still has to set some starting parameters), and then gives the option of progressive automatic refinement as the flow is evaluated. Below is what the D2RS mesh looks like after several refinement cycles.
The model also needs to be prepared for CFD. If we were to plug the full manufacturing model into the simulation it would have way too much detail and be computationally impractical. The full model contains every nut, bolt and washer, which have no impact on aero. It also has the bodywork as a very thin shell so the cell size would have to be tiny in order for CFD to properly ‘notice’ it. This in turn would require a supercomputer and months of work to run. So when I made the CFD models I eliminated all the internal detail that is not pertinent to the simulation. I also ‘thickened’ the bodywork skin so that a reasonably sized cell could be used as a starting point. The manufacturing model has couple thousand parts, the CFD model has half a dozen.
The real trick in making CFD useful is to determine what is accurate enough. And this simply cannot be done without correlation to real world data. Fortunately, as part of our 2012 effort we put strain gages on the suspension pushrods which let us measure actual downforce being generated. We then ran several configurations that are quite different and recorded the results. Once the CFD model was complete, I ran the same configurations and adjusted the parameters until the simulated results matched test data for each configuration, while still fitting into the computer’s 16G of memory. It took a while but once complete, we now have the parameters which we know are meaningfully accurate for something the size and complexity of a D1PPS.
Interestingly, this means that since the D2RS is a bigger car it would not ‘fit’, but because it is symmetrical we can accurately run just half the car and still get valid results. The D1PPS is asymmetrical so the entire thing must be included in order to get accuracy. This is why in the details below you’ll see full pictures for one car and half for the other. Each simulation takes about 8-9 hours on a quad core i7 computer, so I set it up last thing at night and have results in the morning. Computer works the night shift. What is key to making this work useful is the discipline to only change one thing at a time and to keep precise records of both the numbers and the visualization that goes with them.
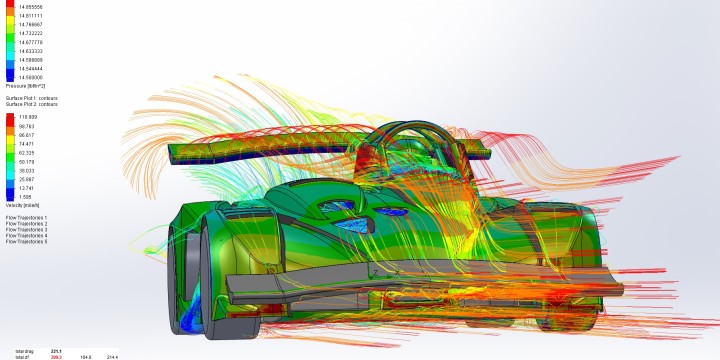
Before we go to each car, I want to mention one more major challenge. And that is the fact that the computer doesn’t know it’s looking at a car. All it knows is solid, fluid and surface. Once the simulation run is complete, you can pick any surface on a solid and the computer will examine each cell it touches, add up all the pressures, and give a result. The result is force along X, Y, and Z axes and torque about each axis, that act on the selected surface. The results are exported in a spreadsheet which looks like this.

That’s it. It doesn’t know drag, downforce or anything like that. It’s up to the operator to take the raw data and somehow make useful sense of it. If it sounds difficult, it is. Took a long time to set up and then figure out a process by which I can efficiently do this for each of the dozens of simulation runs. But now that it’s set up, we have an awesome tool to use in evaluating our options.
D1PPS
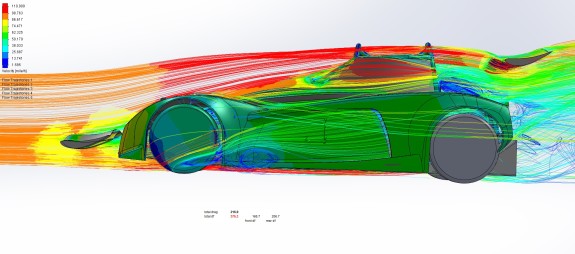
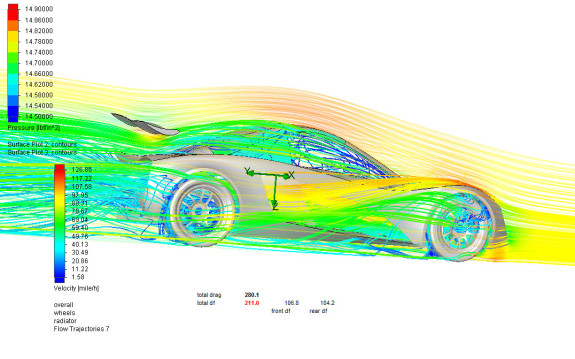
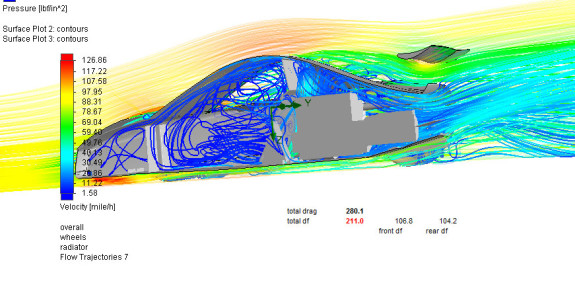
Since we have a baseline from 2012 for the car, the goals for this year are to reduce drag while maintaining or slightly increasing the levels of downforce. Also, having effective adjustability for balance is a requirement. From past results we already know that the lexan side windows are a must, and the flow visualization below shows why. They contain and direct the flow around the cage and driver, which would otherwise ‘spill out’ to a much wider area and interfere with the rear wing as well as the underbody. This has been confirmed in testing.
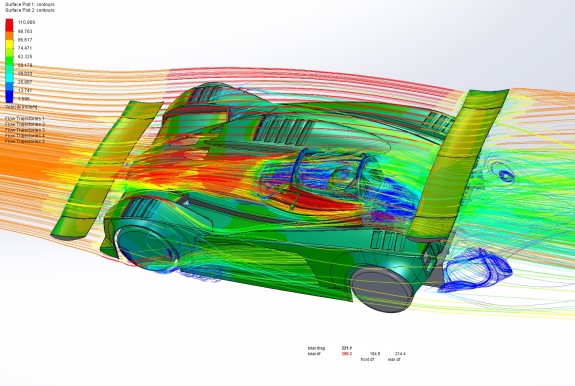
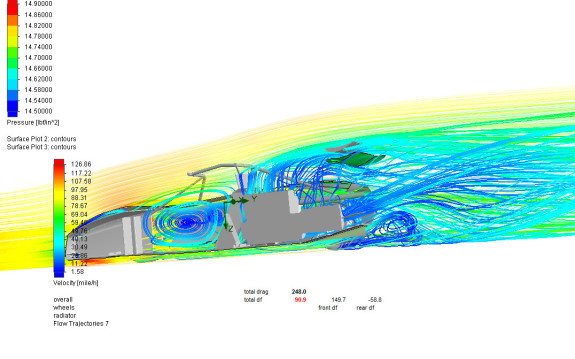
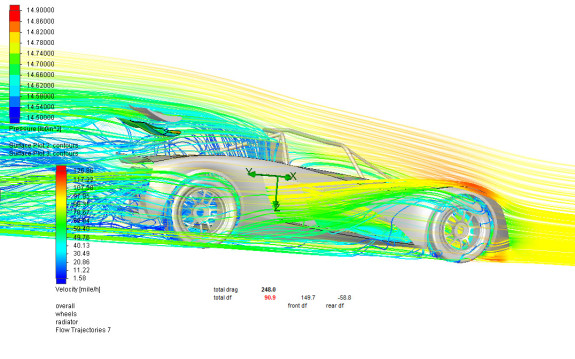
In 2012 we had a simple splitter on the nose. It is actually efficient and effective, but not adjustable. That leaves the rear wing as sole adjustment, so to shift balance forward we couldn’t add downforce at the front – just subtract it from the rear. This year the plan is to run essentially same wings front and rear, both adjustable for angle. To see how effective this would be I ran the front wing at several different angles. Below is an example – it shows the underbody flow with wing at 5 degrees, an illustration of the angle change, then underbody flow at 10 degrees. If you click on the pictures, the numbers show the difference in balance. It’s interesting that overall downforce and drag don’t change appreciably.
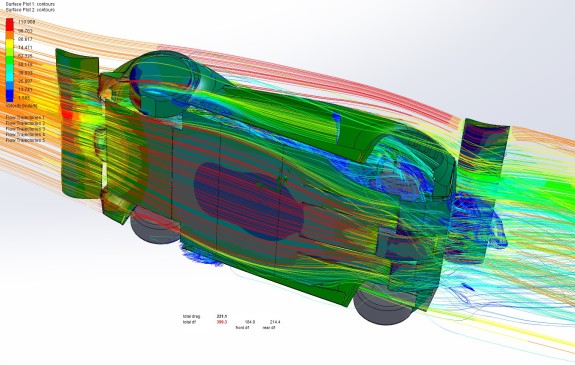
 The blue areas under the car are low pressure. If you look closely, you’ll notice that from first to second picture the blue area in the middle of the car shrinks a bit (resulting in less downforce from the floor), bu the underside of the front wing now has a lot of blue indicating more more downforce there. The total downforce is virtually unchanged at 399 lbs, but front/rear distribution goes from 185/214 to 193/206 (I do all simulation runs at 100 mph). This is very valuable because if during testing the driver tells us he needs more front aero bias, we know exactly what to do. The goal here is not necessarily to get absolute numbers (it’s a simulation so it’s approximate by nature), nor to get the ‘right’ configuration, but to figure out what does what and how things interact. This will enable our testing to be efficient and effective.
Of course it took dozens of runs to come up with the configuration that does what we want. Now that I know what components we’re going to use and where they need to sit in space (height, fore/aft position, angle range), I can design the structural mounts which will let us do this. Then they can be made and installed.
D2RS
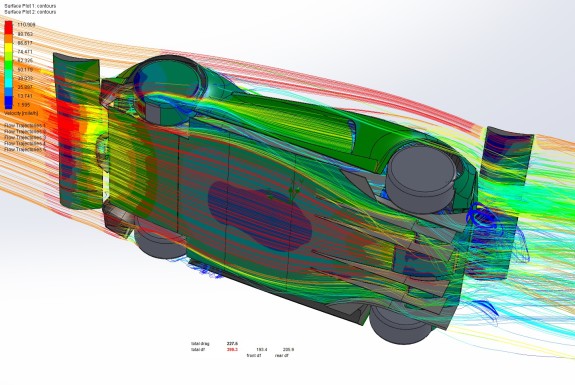
For the D2, the situation is the opposite of the D1. Here the chassis and drivetrain are carried over but the bodywork (and therefore the aero) is brand new. We also don’t know how much of it we’ll be able to finish, so I need to run risk assessment of doing roadster vs coupe. This in turn lets us prioritize – do we sacrifice other things to get the canopy done, or is it a manageable thing to run without? The results are quite interesting. Overall, by being a streetable two-seater, the aero is different than the D1PPS. The D2RS inherently has about 50% more drag and 30% less downforce, which is not unexpected given that we’re comparing a street-legal car with an all-out racer.
Below are pictures of roadster vs coupe.
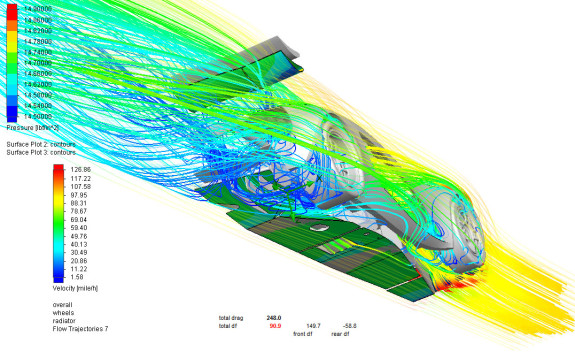
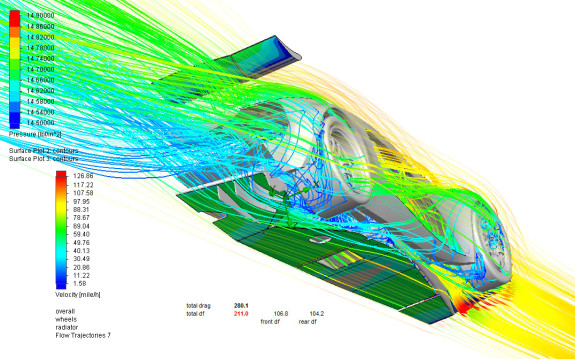
This is just a sample from over a dozen different runs but it illustrates that the coupe is considerably better and worth putting the effort into. There are other discoveries as well and it gives us the information to deal with the contingencies. Like how high to place the rear wing if we run the roadster vs coupe, what effect wing height and angle has on downforce and drag, and so on. Similar to the D1PPS this prepares us for the real testing and allows us to optimize our use of resources. We now know what can be reasonably expected and what tools we have to achieve whatever changes our drivers might want.